Project Details
Secondary research, personas, concept generation and testing, mock-ups, presentation
Reem Alturki, Mary Burt, Jeena Panicker, Riya Rana
Client & Course Details
Client
Lucidchart UX Team | Lucid
Course
INFO-I541 Interaction Design Practice | Fall 2019
Professor
Jeffrey Bardzell
School
Indiana University
Luddy School of Informatics, Computing & Engineering
Overview
Design an onboarding experience to help familiarize users with the product, so they can become productive in “no time”
Improve user engagement and retention
Users are overwhelmed and frustrated by the process of online diagramming, and some pain points remain even when they become familiar with the software.
Productivity will improve engagement and retention, and familiarity will increase productivity. However, there are issues impacting the user experience and hindering productivity that will not be solved through onboarding.
Traditional onboarding screens are largely ineffective.
Many skip over them and some users have to repeat them several times to recall basic functions.
Some find them annoying, especially in cases where they want to get started right away (due to self-proclaimed impatience or context) --> skip
Learning curves vary, and some users may require a lengthier onboarding process.
An onboarding experience users found dull (and/or annoying) the first time around doesn’t become more engaging with repetition.
Challenges & Considerations
Barriers to optimal productivity remain due to pain points beyond the onboarding process.
To significantly improve engagement and retention, we designed a feature that goes beyond onboarding. While balancing the needs of users with varying levels of proficiency, our solution improves the experience of diagramming and addresses barriers to productivity throughout the journey.
Introducing Smartchart
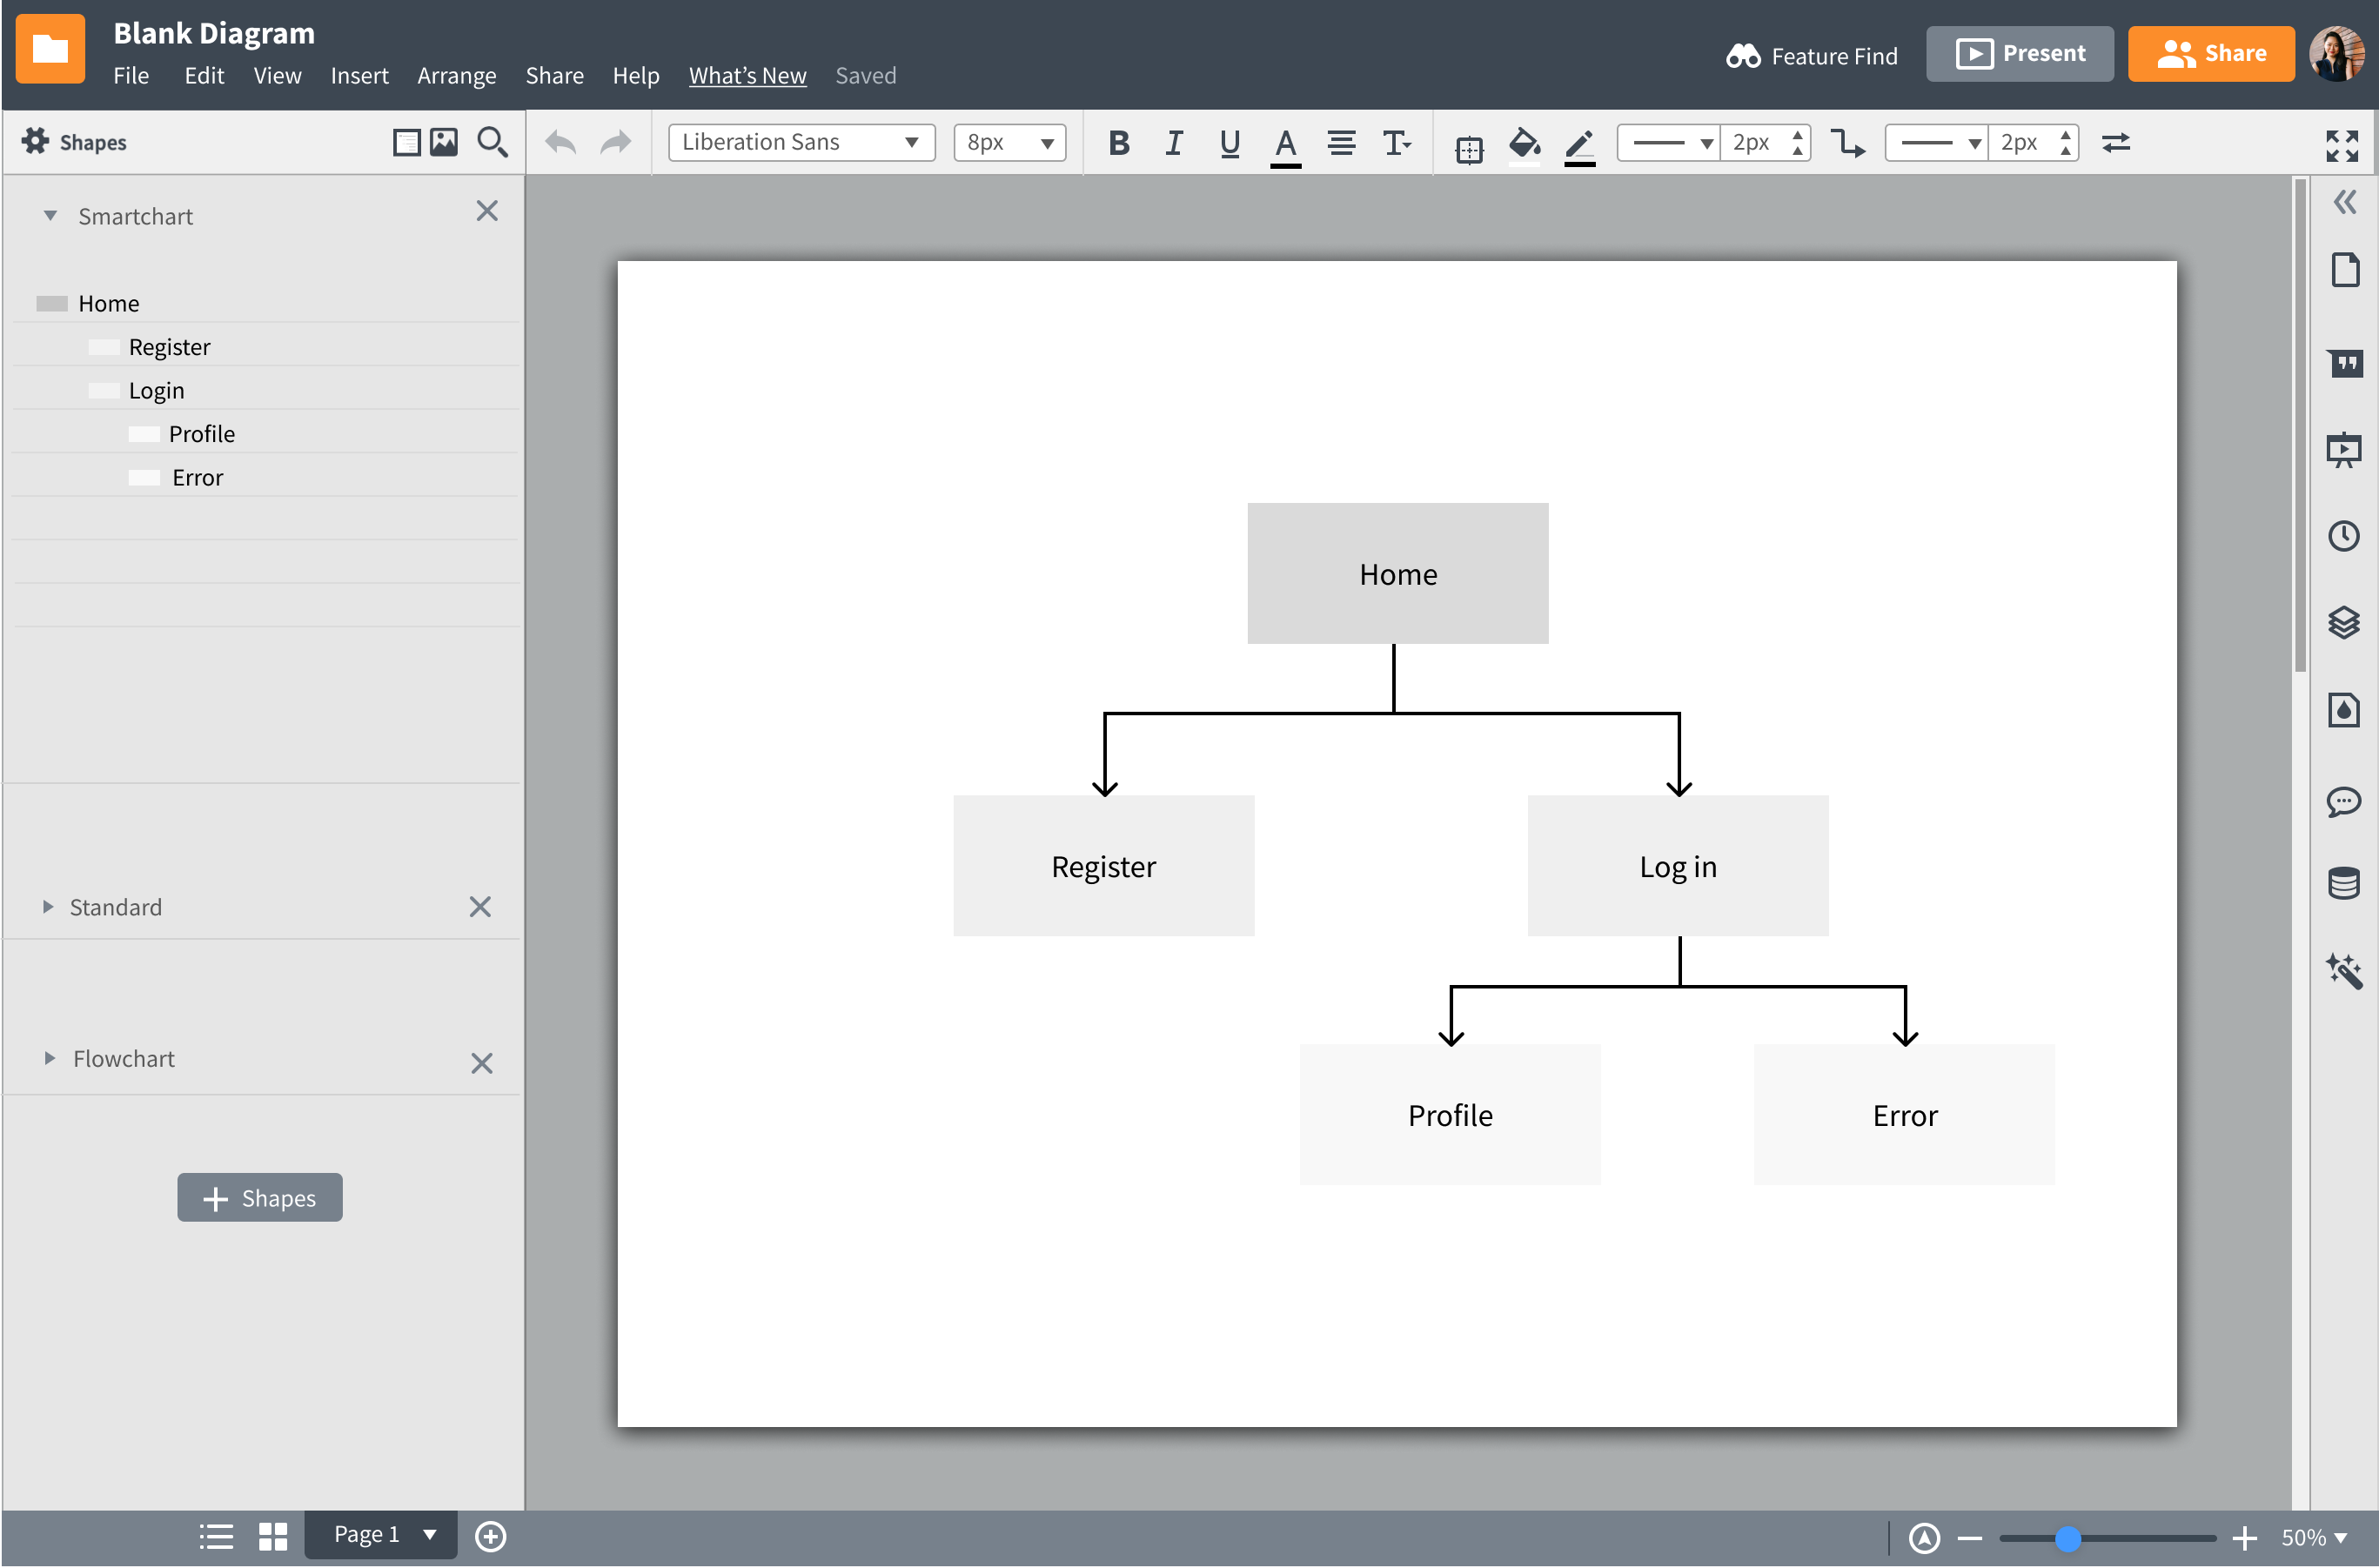
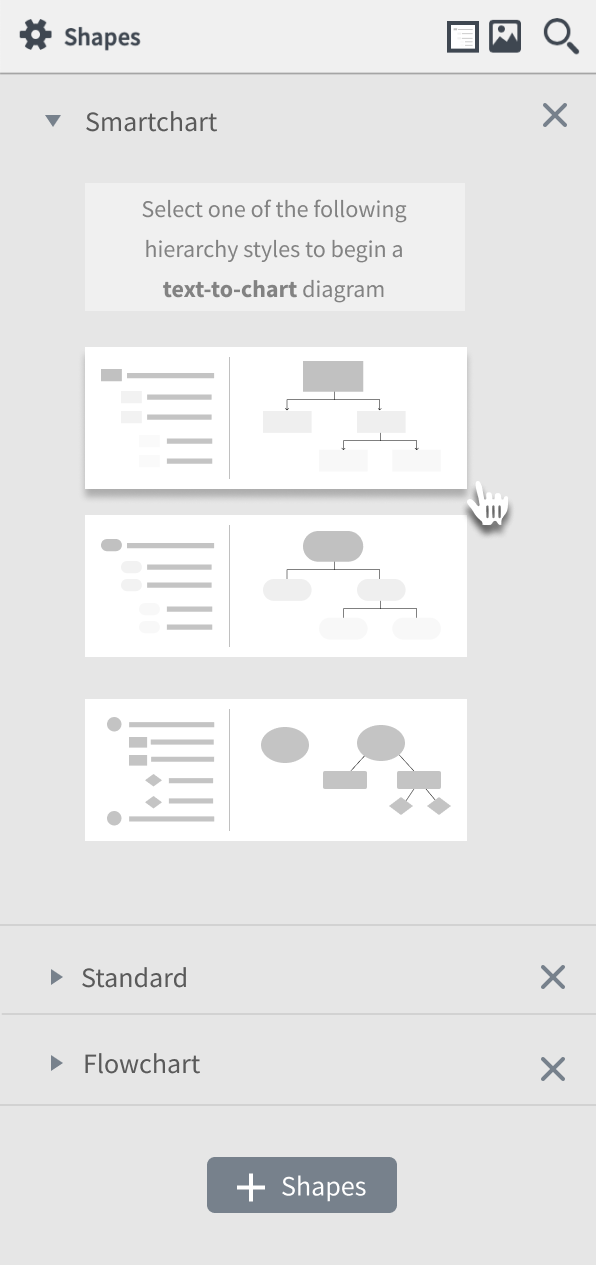
Our proposed text-to-chart feature pairs the simplicity, familiarity, and efficiency of a bullet point system with the power and potential of a visualization tool.
Smartchart is a more intuitive and accessible means of diagramming for users of all experience levels.
Walkthrough
We identified 3 categories of use cases (with most users falling into the first two groups) based on the templates offered by Lucidchart and our analysis of their quantitative & NPS data: academic, professional, and casual.
Novice users are feeling overwhelmed, and would like a simple and minimal UI, and more intuitive features.
Experts regularly use advanced tools, and tend to prefer heavier UI for easier access to advanced features.
Users of all experience levels appreciate templates, but some experience choice overload when it comes to selecting one.
Motivations
People diagram to visualize information for themselves and others. Whether done by choice or out of obligation (e.g., assigned by instructor or boss), the purposes and methods of visualization remain consistent:
- Comprehend complex information
- Easily relay and explain information to others
- Expand creativity and generate new ideas
I use pen and paper when I need my ideas there instantly.
I use digital diagramming tools when there are more details and it needs to look pretty.
Pain points beyond onboarding
Based on our interviews, usability tests, and analysis of Lucidchart's quantitative & NPS data, the two most significant issues impacting user experience and productivity that will not be solved through familiarity are unnecessary labor and the pressure of perfection.
Digital tools give me perfection pressure.
I start focusing on aligning and moving the shapes around instead of completing my visualization.
Pen and paper doesn't have to be perfect and it's fun.
Challenges & Considerations
Visuals
Labels & Details
Low effort: pen & paper
Drawing and connecting simple shapes
Low effort: digital
Typing and using keyboard shortcuts
Medium-High: pen & paper
Erasing and redrawing
Medium-High: digital
Navigating to each new shape to type
High: digital tools
Navigating with mouse, dragging, dropping, connecting, resizing shapes to fit text
High: pen & paper
Writing lots of details by hand, erasing, rewriting
Visuals
Low: pen & paper
Drawing and connecting simple shapes
Medium-High: pen & paper
Erasing, redrawing
High: digital tools
Navigating with mouse, dragging, dropping, connecting, resizing shapes to fit text
Labels & Details
Low: digital
Typing, using keyboard shortcuts
Medium-High: digital
Navigating to each new shape to type
High: pen & paper
Writing lots of details by hand, erasing, rewriting
Our Design
Our proposed text-to-chart feature is simple, familiar, and efficient. Smartchart helps onboard new users quickly and address pain points of existing users.
Smartchart enables users of all experience levels to offload ideas quickly in meetings or while brainstorming, organize their thoughts, and see them reflected in a chart simultaneously.
Automating chart creation maintains a clean aesthetic and minimizes unnecessary labor and perfection pressure.

Smartchart is integrated with Lucidchart's original UI and is collapsible, making it unobtrusive, convenient and efficient.
It offers novice users the simple and minimal UI they desire, and doesn’t impose changes on any existing users.
Our Users (expand for recap of differing needs)
Novice users are feeling overwhelmed, and would like a simple and minimal UI, and more intuitive features.
Experts regularly use advanced tools, and tend to prefer heavier UI for easier access to advanced features.
Users of all experience levels appreciate templates, but some experience choice overload when it comes to selecting one.
Expand and collapse Smartchart in the left panel
.png)
Select a hierarchy style to begin a text-to-chart diagram
.png)
The hierarchy offers the familiarity and efficiency of a bullet point system.
Universal icons and familiar patterns make Smartchart intuitive.
Tooltip: switch to another pre-set hierarchy at any time.
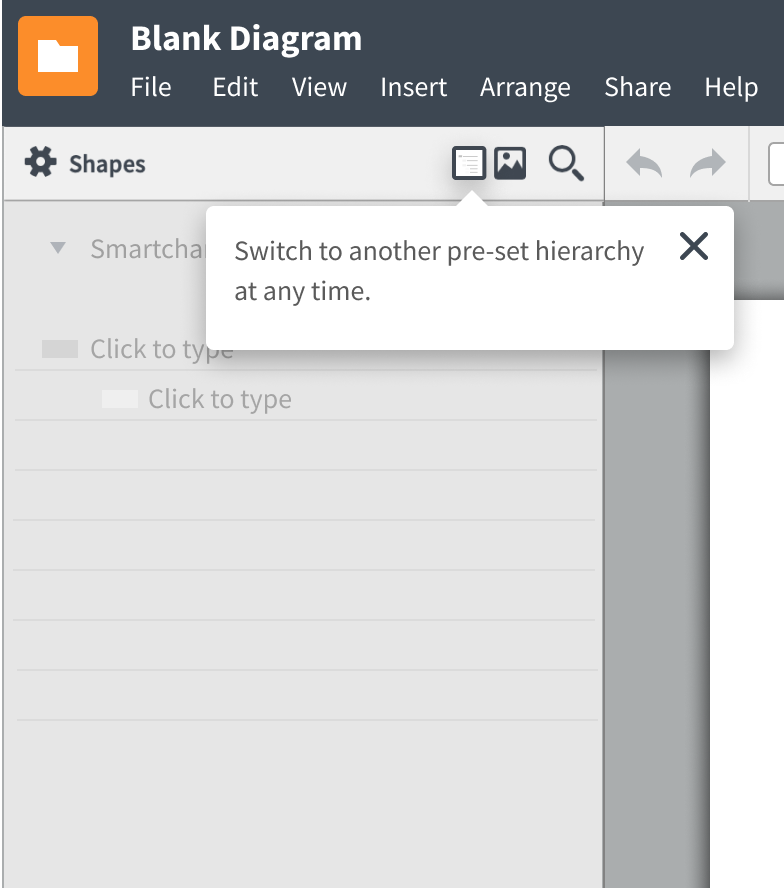
Icons and dropdown menu are consistent with standard bullet points.
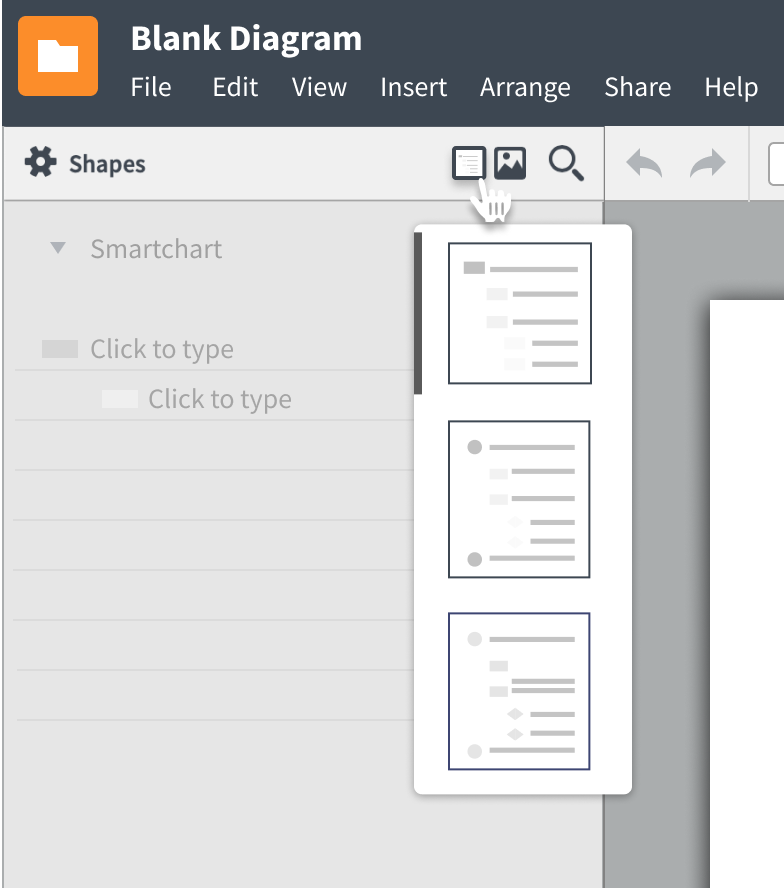
Mapping shapes and colors from the hierarchy to the chart helps prevent errors and orients users quickly.
Automatic connections between shapes reduces unnecessary labor.
Quickly create and navigate between points using the Enter, Tab, and arrows keys.
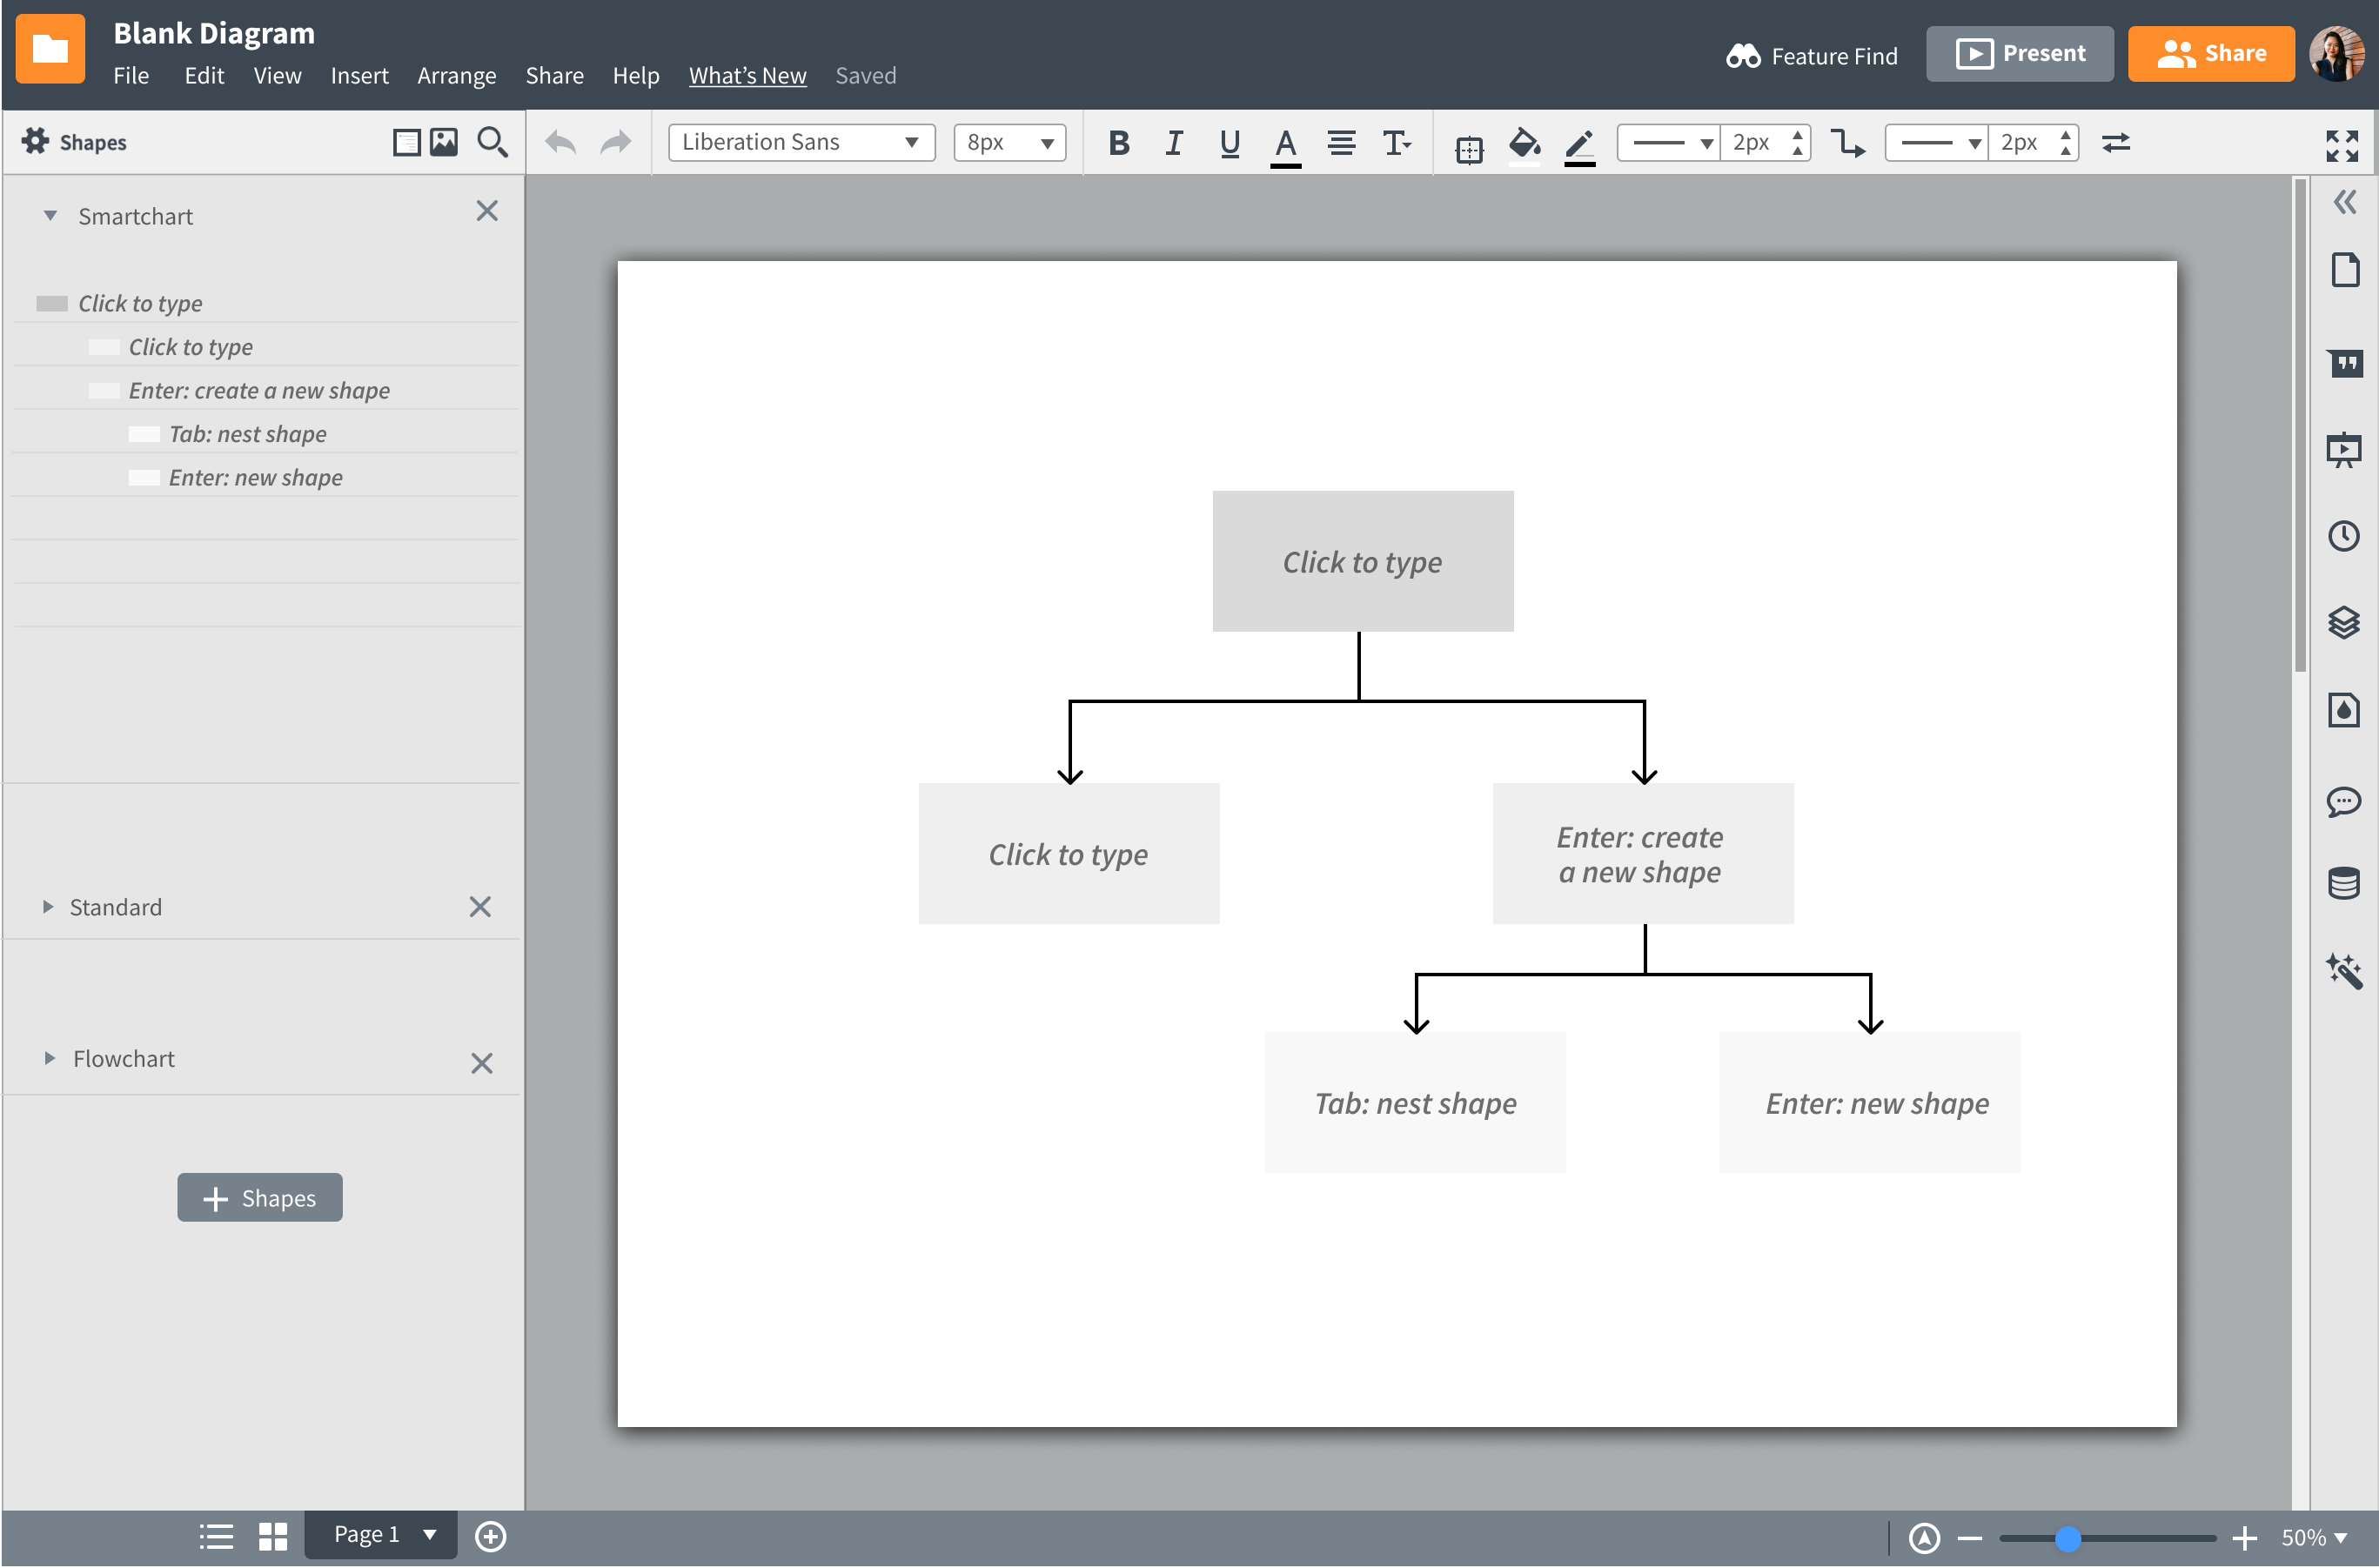
Enter creates a new shape (or "point")
Tab nests the shape with the one above (or creates a "sub-point")
Shift + Enter jumps to a new line within the same shape
Post-project adjustment: I added an example with the keyboard commands written in the hierarchy and on the chart as placeholder text to cue the user and assist with onboarding.
Note that an option to edit the type and style of the connectors all at once should be added to the left panel or the hierarchy dropdown menu.
Updating charts is now quicker and easier, as the need to drag and drop is limited to content within the hierarchy.
Rearrange as needed, and Smartchart will automatically change the locations, connections, and the styles of the shapes where applicable.
Click and drag a specific point to the desired spot on the hierarchy.
.png)
The diagram is updated to reflect changes made in the hierarchy.
.png)
Smartchart is flexible and can be used with or without templates to fit various contexts, user preferences, and needs.
Smartchart + Blank Canvas
- Begin immediately
- Decrease decision fatigue experienced by some users when selecting a template.
- Reduce distraction of styling, and decrease unnecessary labor later (think: content before design)
Smartchart + Templates
- Use when you know exactly what you need (whether from the get-go or after browsing)
- Still reduces unnecessary labor in regards to navigation and formatting
Here, Smartchart is being used with a Venn diagram template. Shift + Enter allows the user to jump to a new line within the same shape.
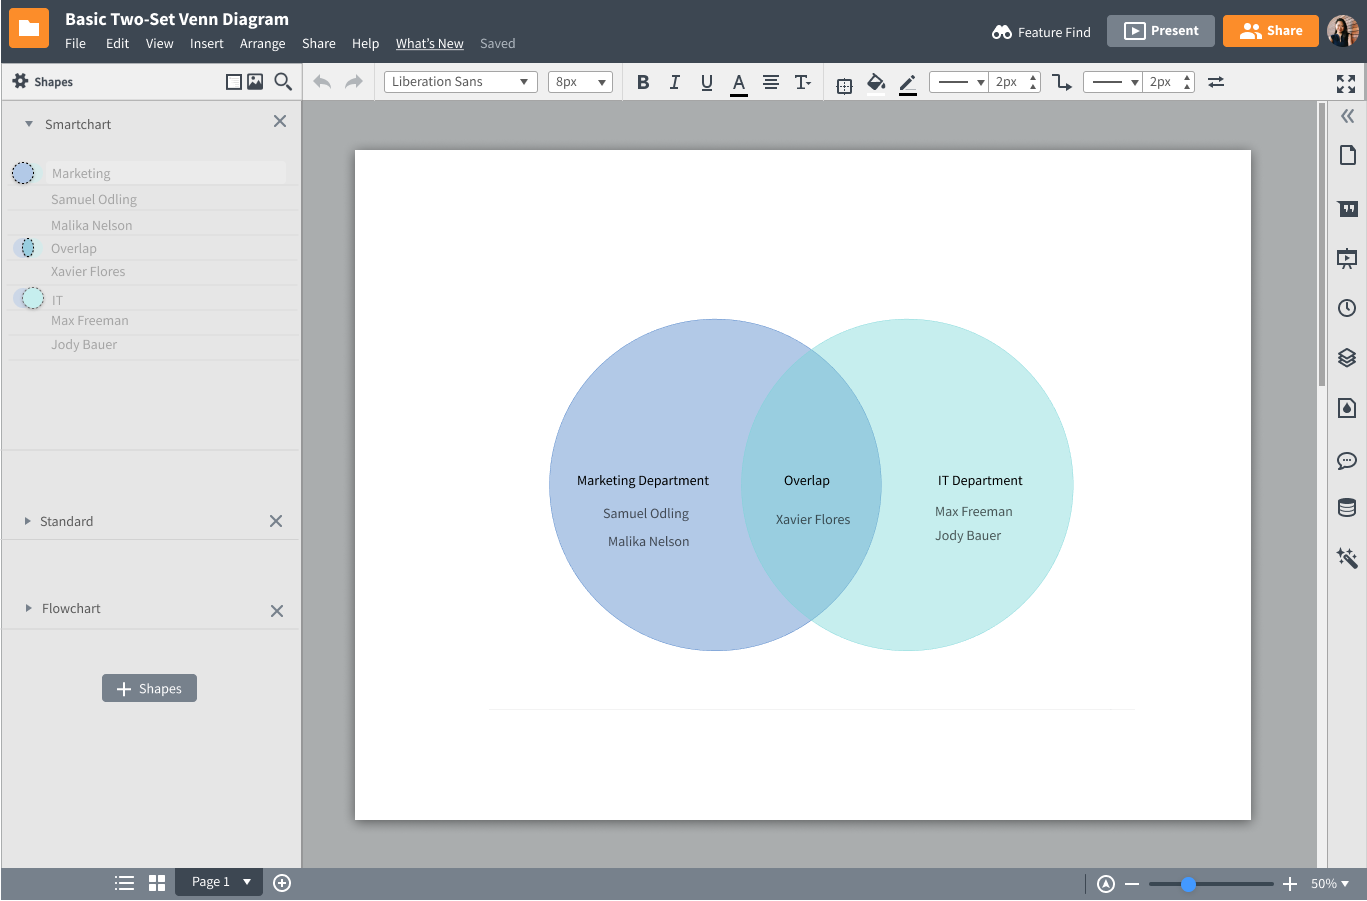
Smartchart greatly reduces pain points of diagramming, with both digital tools and pain and paper:

Navigating to each new shape to type

Navigating with mouse, dragging, dropping, connecting

Resizing shapes to fit text

Erasing and redrawing

Writing lots of details by hand, erasing, rewriting
Implementation Plan
We discussed the feasibility and implementation of Smartchart with two software engineers. Assuming a team of 2-3 engineers, and adopting the Scrum framework, we propose the following timeline totaling five to six and a half weeks.
- Hierarchy with corresponding shape icons
- Navigate the hierarchy with Enter, Shift + Enter, and Tab
- Auto customization (color, size, shape)
- Text/line highlight (corresponds with individual shape on canvas)
- Support for complex diagrams (like ERDs, which will include a key for quick reference)
- Custom UI layouts (similar to Adobe and Unity3D), so users can easily access the right tools at the right time, optimizing their workflow and further improving productivity
Whew! You made it! Care to stick around for another project?

